Four ways plants miscompute OEE
OEE is the most-cited number on a shop floor and the most often wrong. Four definition errors that inflate it, worked through on one baseline shift.
- OEE
- downtime
- metrics
Your OEE went up four points last quarter and nothing changed on the floor. Somebody moved a definition.
That happens more often than anyone admits, because the formula looks harmless. Three fractions, multiplied together:
OEE = Availability × Performance × QualityEach fraction has a numerator and a denominator, and somebody in your plant decides what goes in them. Four common decisions all push the result the same direction.
Here’s a clean shift to argue against. 480 minutes, 72 minutes of unplanned stoppage, a 30-second ideal cycle, 750 units out, 720 of them good.
| Component | Arithmetic | Result |
|---|---|---|
| Availability | (480 − 72) / 480 | 85.0% |
| Performance | (30 × 750) / (408 × 60) | 91.9% |
| Quality | 720 / 750 | 96.0% |
| OEE | 0.850 × 0.919 × 0.960 | 75.0% |
Seventy-five percent. Here’s the same shift after one definition moves.
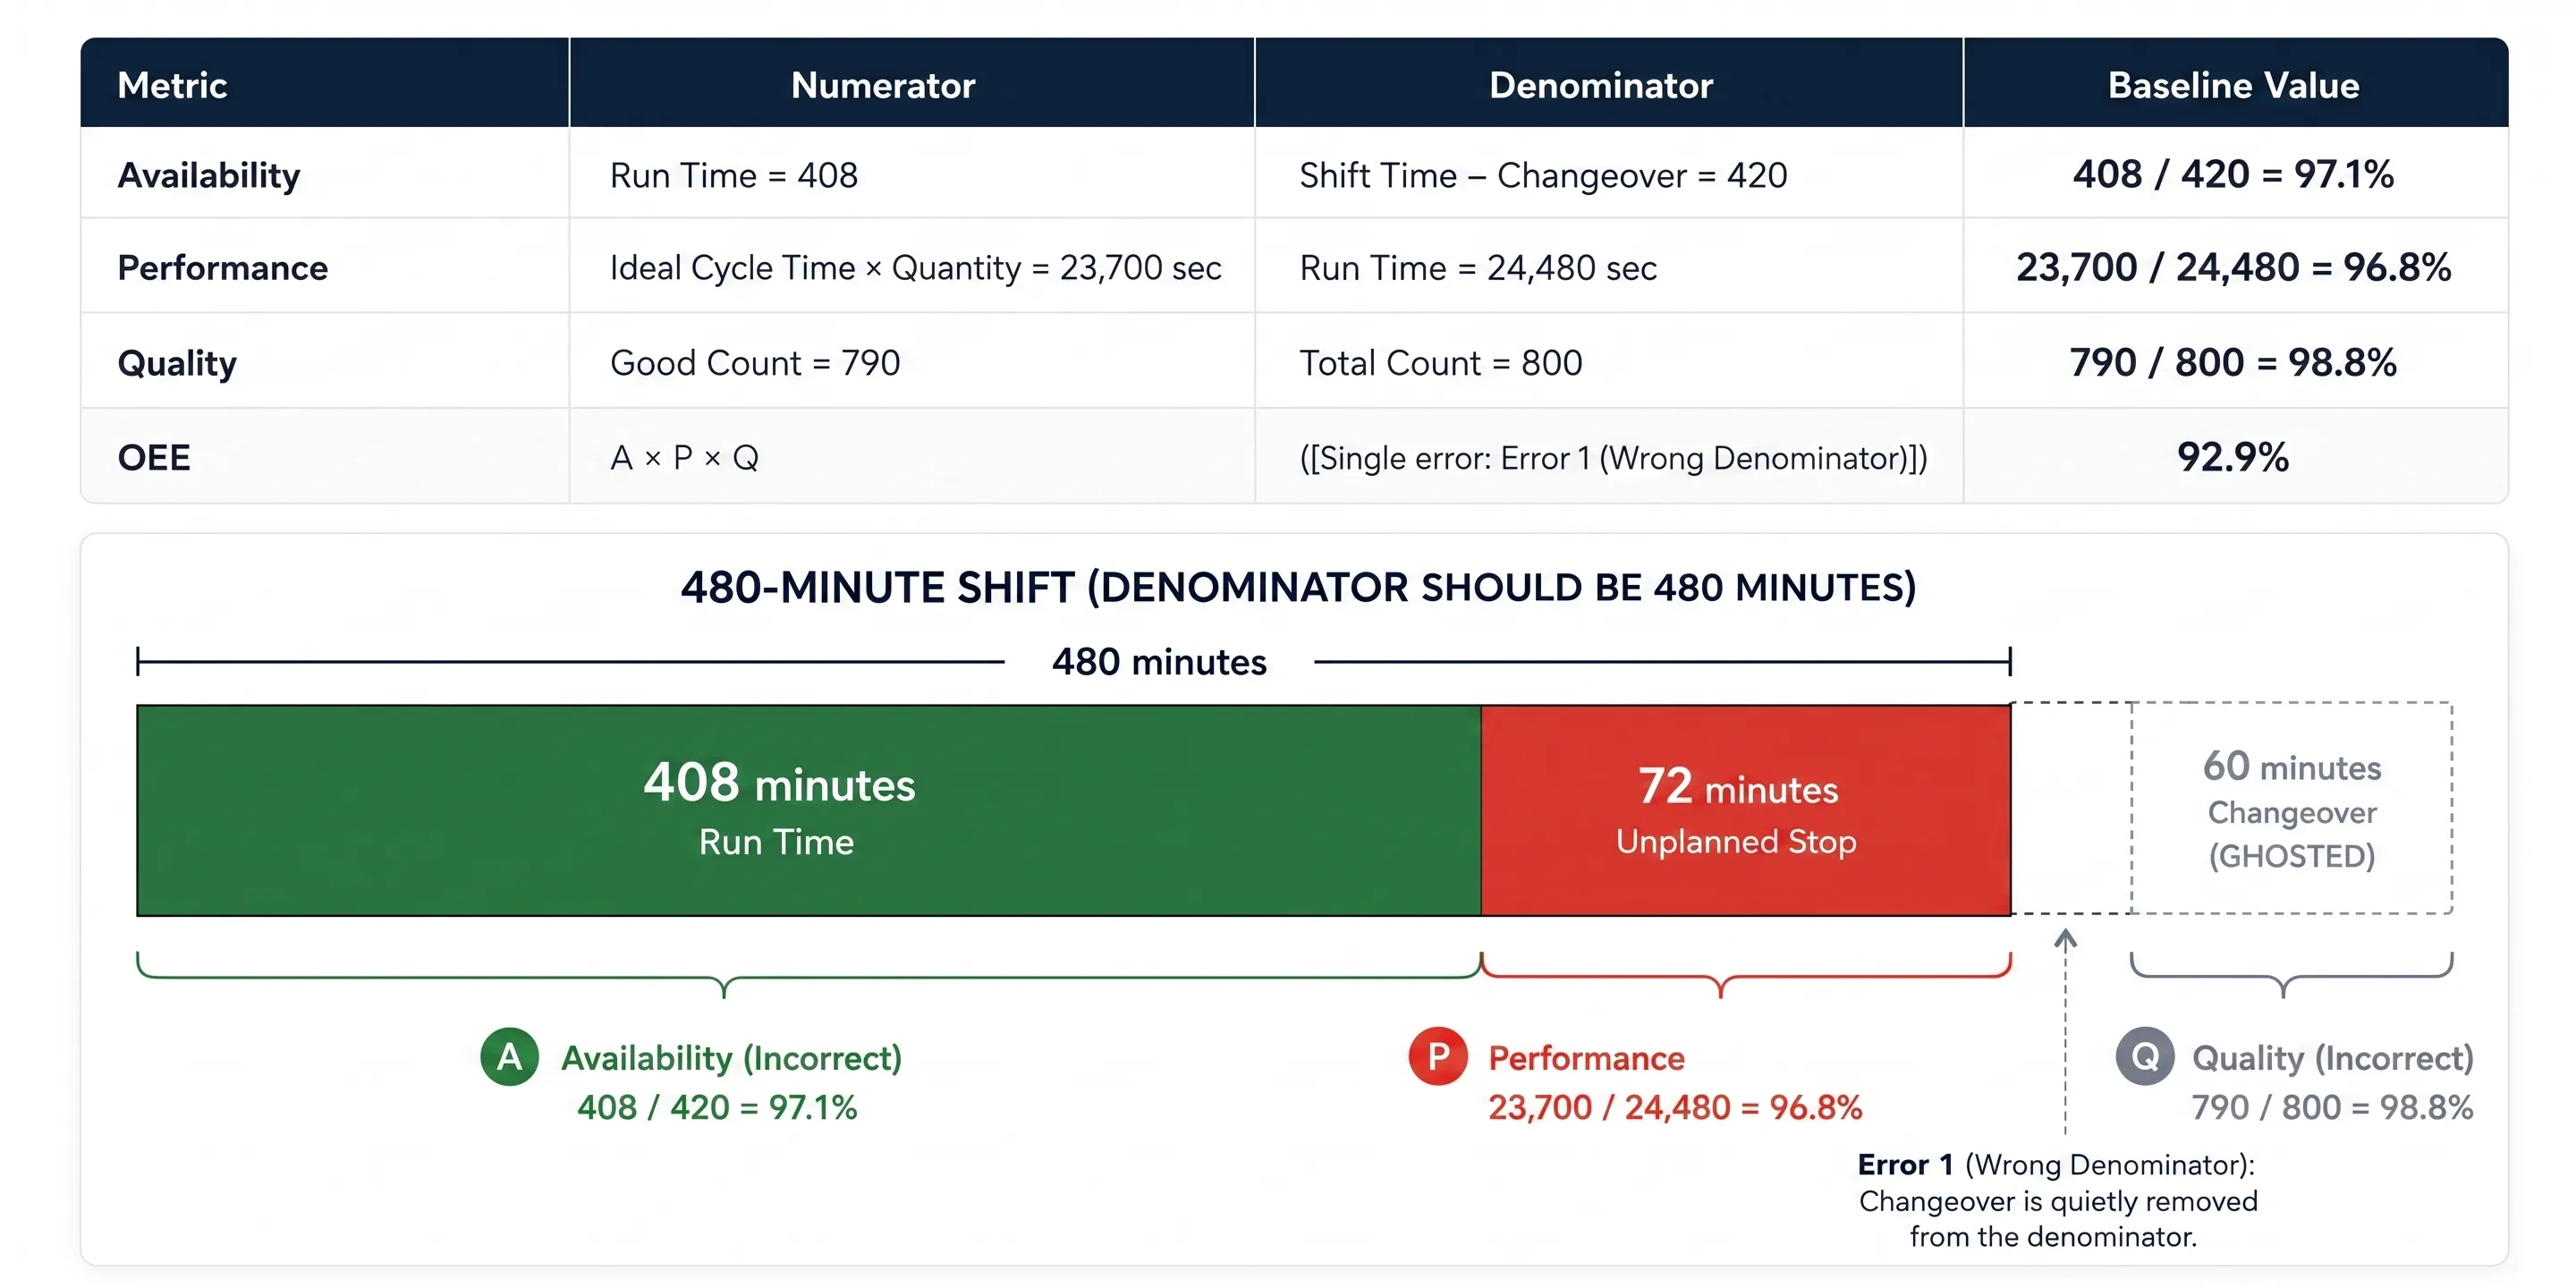
The 60-minute changeover slides out of the denominator, Availability jumps from 85.0% to 97.1%, and reported OEE lands at 92.9%. Nothing on the line changed.
1. Planned downtime disappears
Changeovers, breaks, scheduled maintenance. They get pulled out of planned production time, so they never land anywhere in the calculation, and what comes out the other end describes a shift that didn’t happen.
Say 60 of those 480 minutes were a planned changeover. Drop them from the
denominator, leave the run-time counter reading 408, and Availability reports
408 / 420 = 97.1%. Twelve points, and not one extra unit left the line.
Planned and unplanned stoppages are both real. Keep them apart so OEE answers one question, how well did we run when we meant to run, and keep a second view for how much of the calendar you used at all. Blend them and you get a number that holds steady while the plant gets worse.
2. Ideal cycle time drifts toward reality
Performance is ideal cycle time times total count, over run time. Set “ideal” to the rate the line currently manages instead of its nameplate rate and the fraction walks itself to 100%. Speed loss stops existing.
In the shift above, ideal is 30 seconds and Performance is 91.9%. Set ideal to the 32.6 seconds the line actually achieved and Performance reads 100.0%. Same line, same output, new yardstick.
Ideal cycle time belongs to the machine, not to last quarter’s average. When it moves, that should be an engineering decision with a date on it, not a quiet spreadsheet edit.
3. Rework counts as good
Quality is good count over total count. Units reworked back into specification usually get counted as good, because they shipped in the end.
They also consumed cycle time twice, and rework is the exact loss the Quality term exists to surface. Move 20 reworked units from scrap to good and Quality climbs from 96.0% to 98.7%, OEE from 75.0% to 77.1%. Two points, and nothing improved.
Count first-pass yield. Give rework its own reason code so it stays visible instead of quietly getting absorbed.
4. Rollups average instead of recompute
This one survives in plants that get the first three right, because it happens later, in the summary.
Line 1 ran 480 minutes at 90% OEE. Line 2 ran 120 minutes at 50%. Average those and you report 70%. Recompute from the totals, weighted by the time each line actually ran, and the plant did 82%. The naive average is twelve points light, and it’ll be light by a different amount every week depending on the run mix.
Ratios don’t average. They have to be rebuilt from the underlying totals, across shifts, across weeks, across sites.
Which brings up the 85% benchmark everyone repeats. It means very little until those four definitions are pinned down. ISO 22400-2 standardises them if you want a reference your quality team already recognises. A plant reporting 85% on a moving ideal cycle time isn’t beating a plant reporting 68% honestly, it’s measuring something else. The comparison worth having is your own line against itself, on definitions that haven’t shifted underneath you.
So it’s a documentation problem before it’s an analytics problem. That’s why every OEE input in Haltless traces back to a row you can open: planned production time, run time, the ideal cycle time configured for that machine, good count, reject count. Rollups get recomputed from totals rather than averaged. Planned and unplanned stoppages carry separate reason codes. And changing a machine’s ideal cycle time lands on the audit chain with a name and a timestamp against it.
The OEE use-case page has the full worked example.